Salesforce Data Loader and
Duplicate Records Management
If batch size is set to 1
then
what is the performance degradation?
(a lot!)
Problem Statement
When loading a Salesforce database using Data Loader, and in order
to have Salesforce properly detect duplicate records that may
exist in the input file, then turn on duplicate record detection
in Setup, and set Data Loader batch size to one. Records in a Data
Loader input file are committed to the Salesforce database in
increments equal to batch size, and if it is set to one then
duplicates in the input file will be detected by Salesforce
duplicate management. For details on how to configure and activate
Salesforce duplicate record management please see this article:
https://www.salesforceben.com/6-salesforce-duplicate-rules-you-need-to-activate-right-now/
The disadvantage of setting batch size to one is that it
significantly degrades performance, as shown in the table below.
Batch Size
|
Insert 2,500
Accounts |
Delete 2,500
Accounts
|
200
|
35 Seconds
|
24 Seconds
|
1
|
24 Minutes
|
18 Minutes
|
2,600
|
28 Seconds
|
24 Minutes
|
Following are some comparisons of execution time using three
different batch size values.
Load and delete 2,500 accounts with batch size = 200
This seems to be the Data Loader default. With batch size set to
200, using Data Loader, 2,500 accounts were loaded into a
developer org. This consistently took 35 seconds to run. Deleting
the same 2,500 accounts using Data Loader consistently took 24
seconds.
Data Loader is the tool of choice if the number of input records
exceeds the 50,000 record capacity of Data Import Wizard. Tests
and measurements conducted for this article were done using a
developer org which has capacity limitations precluding use of
larger input data sets.
A Wire Shark packet trace and the Mac’s Activity Monitor shows the
batch size value controls not only update denomination,
but transmission as well. Records are to be transmitted
from a user’s computer to the Salesforce host in increments equal
to the batch size value. Network latency is almost certainly
greater than database latency, so the question becomes how much of
the performance degradation is due to network latency, and how
much of it is database latency on the host side?
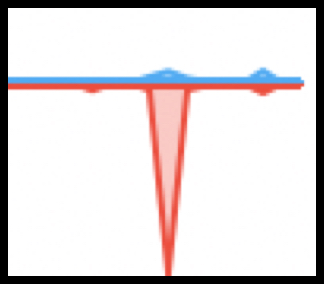
The following graph from Mac Activity Monitor shows transmitted
and received bytes during the 35 seconds it took to load 2,500
accounts with batch size set to 200. The red area indicates bytes
transmitted, which is the data, and the blue area represents bytes
received, which is the TCP acknowledgements and progress messages.
Bytes sent (red) and received (blue)
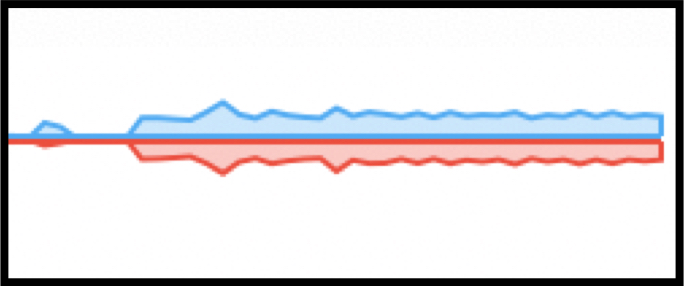
When running the delete transaction, the size of a data packet
sent, containing only the record ID, is small and close to the
size of the returned acknowledgement. That would explain the
following graph, recorded during the 24 seconds it takes to delete
2,500 account records using a batch size of 200. The graph shows
an approximately equal number of bytes sent and received during
the delete process.

Bytes sent (red) and received (blue)
Load and delete 2,500
accounts with batch size = 1
With batch size set to one, it took 24 minutes to load the same
2,500 account records into the developer org. It took 16 minutes
to delete the accounts.
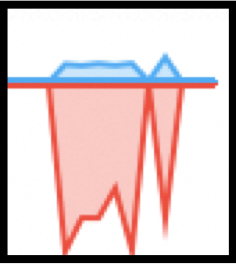
When batch size is set to one the insert
process is painfully slow, at about 1.7 records per second. Data
transfer during the insert transaction consistently shows an
approximately equal quantity of bytes sent and received, as shown
in the following graph. The Wire Shark packet trace shows one
record is sent for each acknowledgement received.
Bytes sent (red) and received (blue)
Load and delete 2,500
accounts with batch size = 2600
With “Use Bulk API” enabled and batch size set to 2,600, it took
28 seconds to load the same 2,500 accounts, and 24 seconds to
delete. I used batch size of 2,600 to ensure the entire input
file, of 2,500 records, would be transferred and committed at one
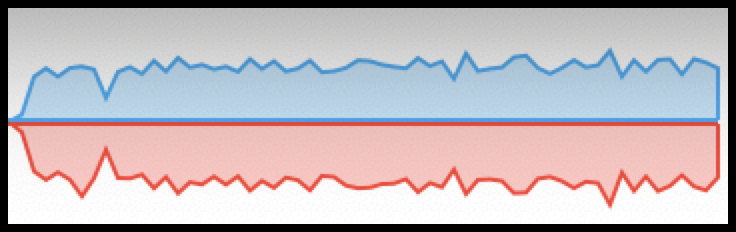
time. The following graph, from Mac Activity Monitor, shows bytes
sent and received during insert execution of 2,500 accounts with
batch size is set to 2,600 and ‘Use Bulk API’ is checked. This is
a fast execution, 28 seconds, and it would appear from the graph
that all 2,500 records were transmitted to a host in a very short
interval. The red area represents bytes sent and the blue area is
bytes received.
Bytes sent (red) and received
(blue)
A different pattern is visible during the 24 seconds it took to
delete the 2,500 account records with batch size set to 2,600. The
volume of bytes received, shown in red, is approximately equal to
the volume of bytes sent, shown in blue. This would appear
consistent with the previous graph of a delete transaction, with
the delete record and acknowledgement being about the same size.
Bytes sent (red) and received
(blue)
Conclusions
The difference in wall-clock time to update or delete records in
Salesforce using Data Loader varies with surprising significance
depending on the value of batch size. Using a batch size of one
causes updates and deletes to be inordinately slow.
- Using a default batch size of 200, tests show
an update rate of about 70 records per second.
- Increasing the batch size to a value exceeding
the number of input records, and with the “Use Bulk API”
setting enabled, improves wall-clock time by about 22 percent.
- Setting batch size to one, which would be
needed to detect duplicate records in a batch, slows the
update rate from about 70 records per second, down to about
1.7 records per second.
The Wire Shark packet traces prove that insert and delete records
are transmitted to the Salesforce host in increments equal to the
batch size. This raises the question of whether the painfully slow
update rates observed are the result of network latency or latency
on the database host. These tests were conducted from a home
office with, a relatively slow residential cable connection to the
internet, using a developer org of limited data storage capacity.
Test results may look different when run from a client with a
faster network connection. Stay tuned for that update in an
upcoming report.
Right now the test results suggest a batch size of one, necessary
to detect duplicates within an input file, significantly slows the
update process, inducing a tremendous performance penalty that
many users may find unacceptable.